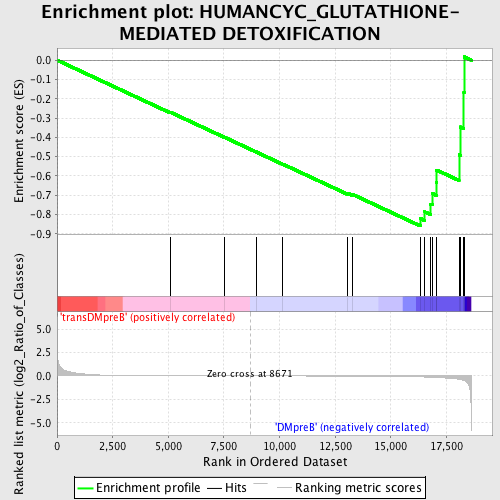
Profile of the Running ES Score & Positions of GeneSet Members on the Rank Ordered List
| Dataset | Set_04_transDMpreB_versus_DMpreB.phenotype_transDMpreB_versus_DMpreB.cls #transDMpreB_versus_DMpreB.phenotype_transDMpreB_versus_DMpreB.cls #transDMpreB_versus_DMpreB_repos |
| Phenotype | phenotype_transDMpreB_versus_DMpreB.cls#transDMpreB_versus_DMpreB_repos |
| Upregulated in class | DMpreB |
| GeneSet | HUMANCYC_GLUTATHIONE-MEDIATED DETOXIFICATION |
| Enrichment Score (ES) | -0.8595207 |
| Normalized Enrichment Score (NES) | -1.4991004 |
| Nominal p-value | 0.030927835 |
| FDR q-value | 0.63642997 |
| FWER p-Value | 1.0 |
| PROBE | DESCRIPTION (from dataset) | GENE SYMBOL | GENE_TITLE | RANK IN GENE LIST | RANK METRIC SCORE | RUNNING ES | CORE ENRICHMENT | |
|---|---|---|---|---|---|---|---|---|
| 1 | GSTA2 | 4808 6173 | 5094 | 0.010 | -0.2700 | No | ||
| 2 | GSTM2 | 9049 4810 | 7506 | 0.002 | -0.3987 | No | ||
| 3 | GSTA3 | 14287 | 8943 | -0.001 | -0.4757 | No | ||
| 4 | GGH | 20186 16264 | 10147 | -0.003 | -0.5391 | No | ||
| 5 | GSTM3 | 9050 | 13053 | -0.014 | -0.6898 | No | ||
| 6 | GSTM1 | 4809 9048 | 13294 | -0.016 | -0.6966 | No | ||
| 7 | MGST2 | 15597 | 16326 | -0.100 | -0.8206 | Yes | ||
| 8 | GSTA4 | 19371 | 16524 | -0.115 | -0.7865 | Yes | ||
| 9 | GSTM4 | 15199 | 16783 | -0.140 | -0.7461 | Yes | ||
| 10 | GSTT1 | 19730 | 16872 | -0.151 | -0.6920 | Yes | ||
| 11 | GSTZ1 | 21193 | 17043 | -0.169 | -0.6353 | Yes | ||
| 12 | GSTP1 | 9051 4812 4811 | 17055 | -0.171 | -0.5694 | Yes | ||
| 13 | GSTO1 | 23838 | 18067 | -0.344 | -0.4898 | Yes | ||
| 14 | GSTT2 | 9052 | 18137 | -0.378 | -0.3463 | Yes | ||
| 15 | MGST1 | 17254 | 18284 | -0.474 | -0.1696 | Yes | ||
| 16 | MGST3 | 13771 12349 | 18298 | -0.481 | 0.0171 | Yes |

